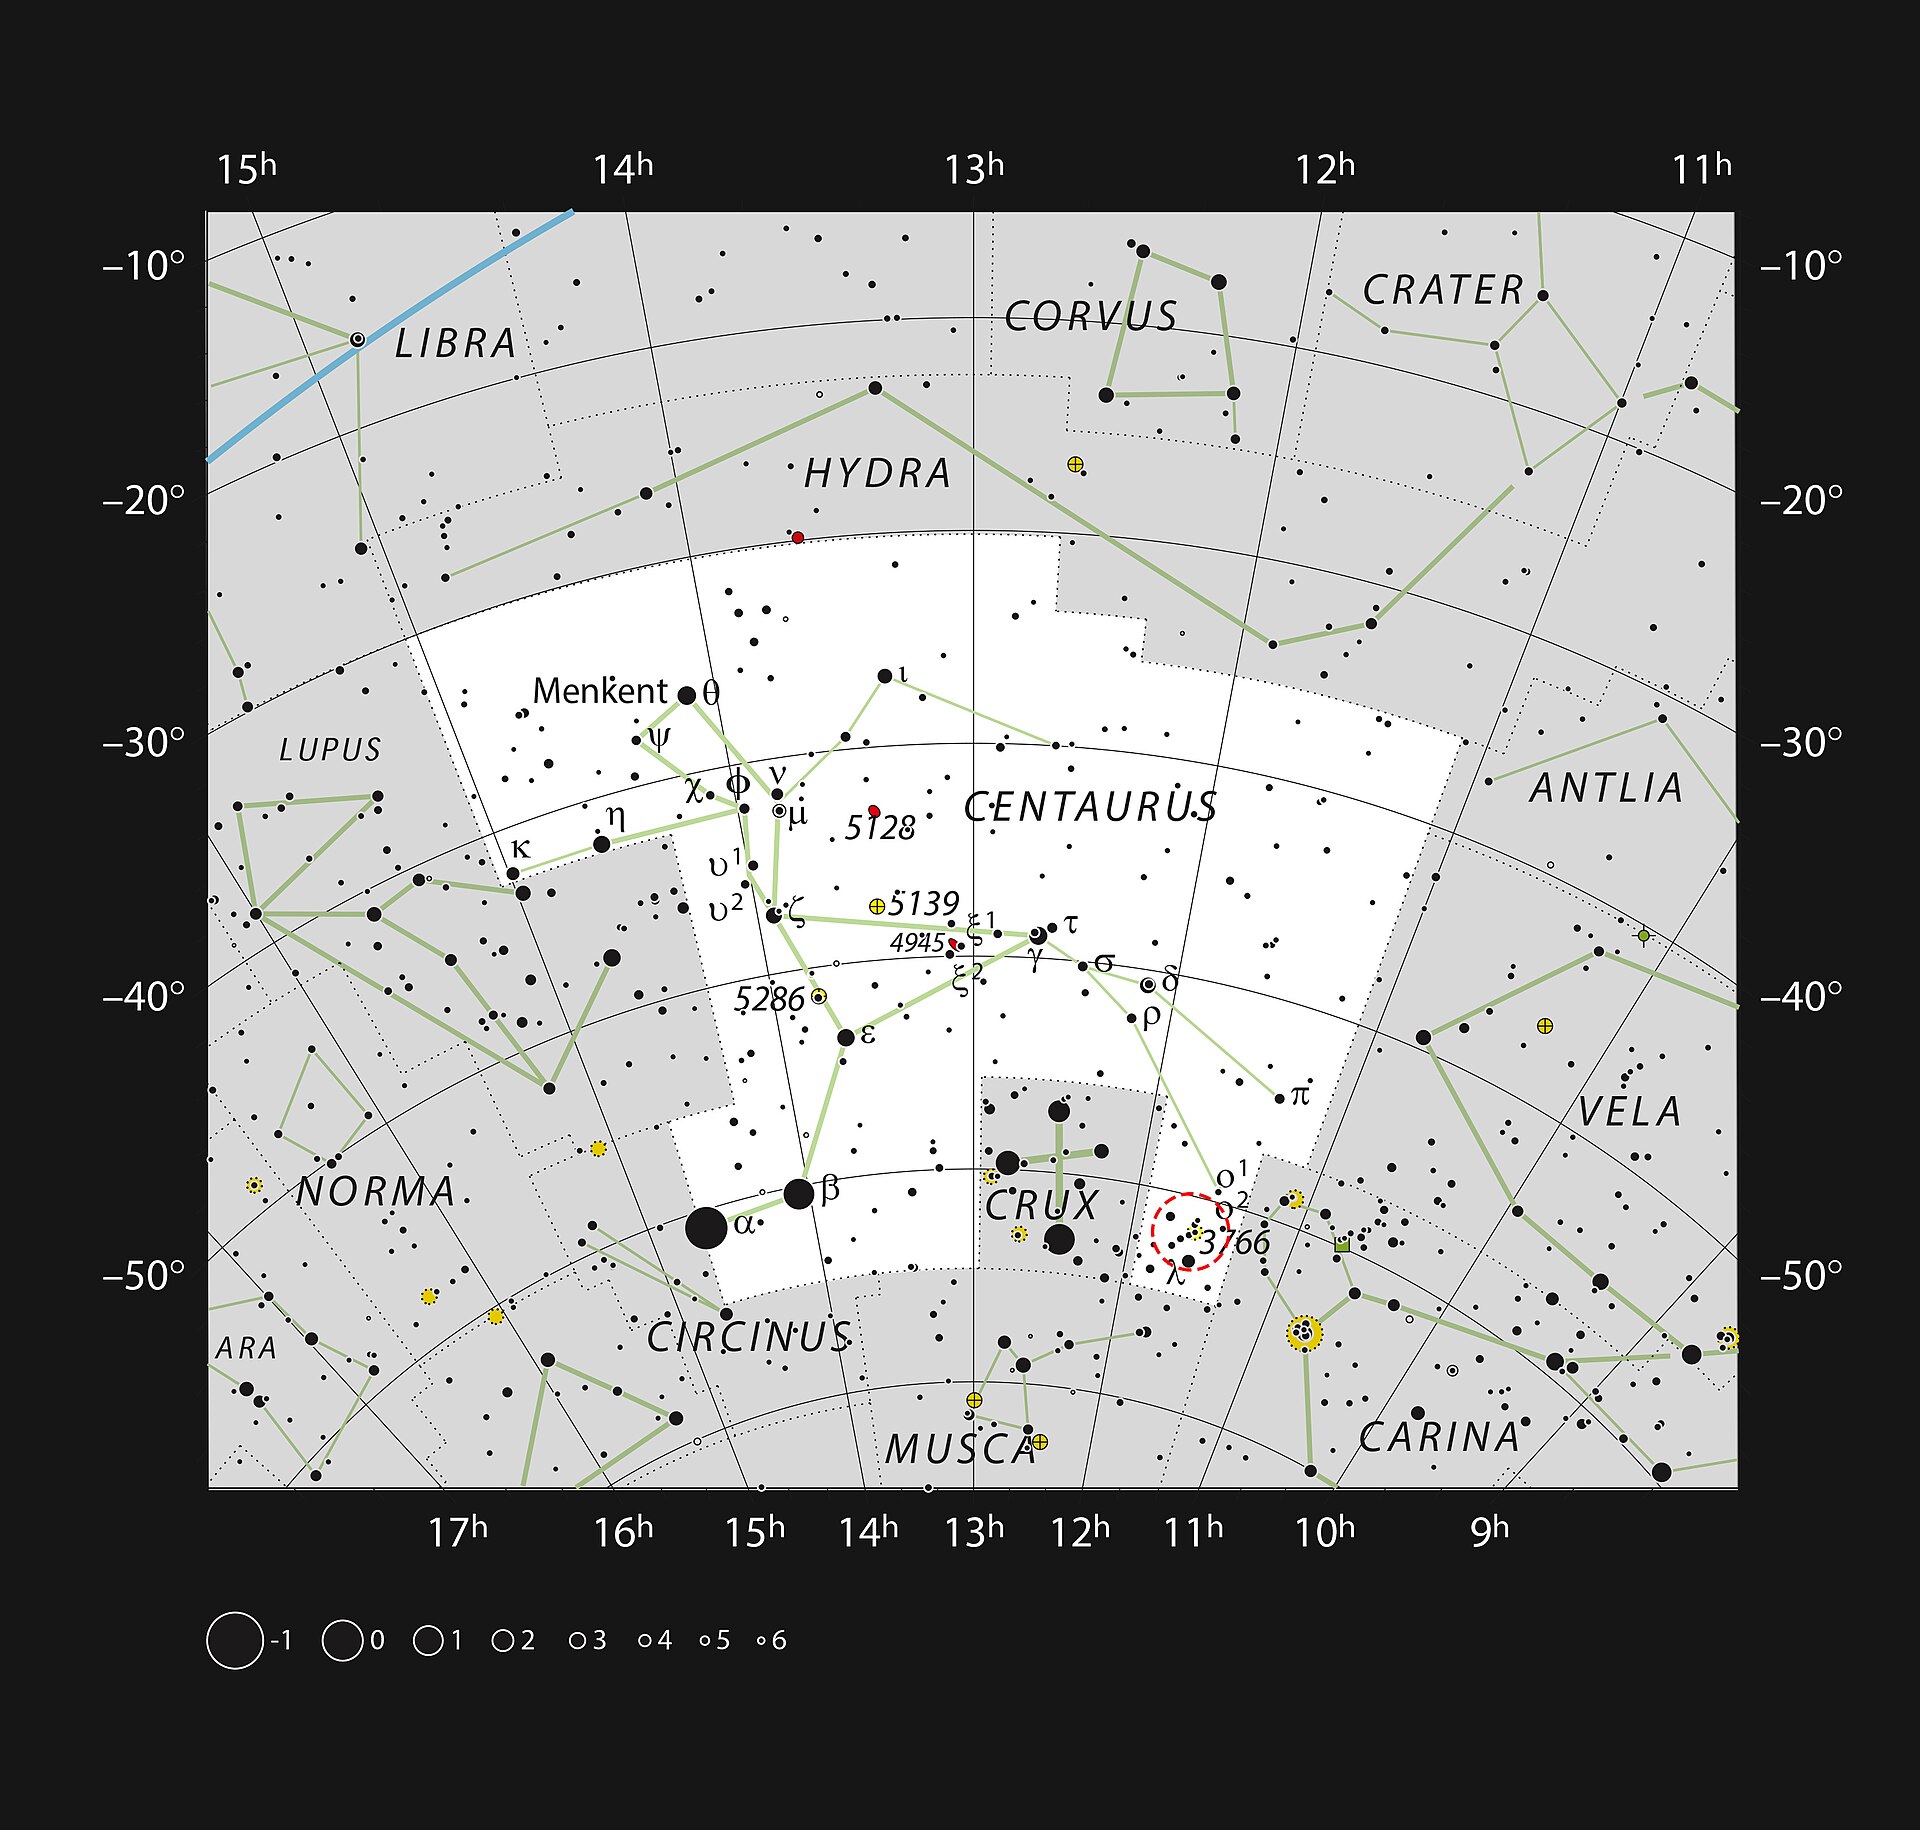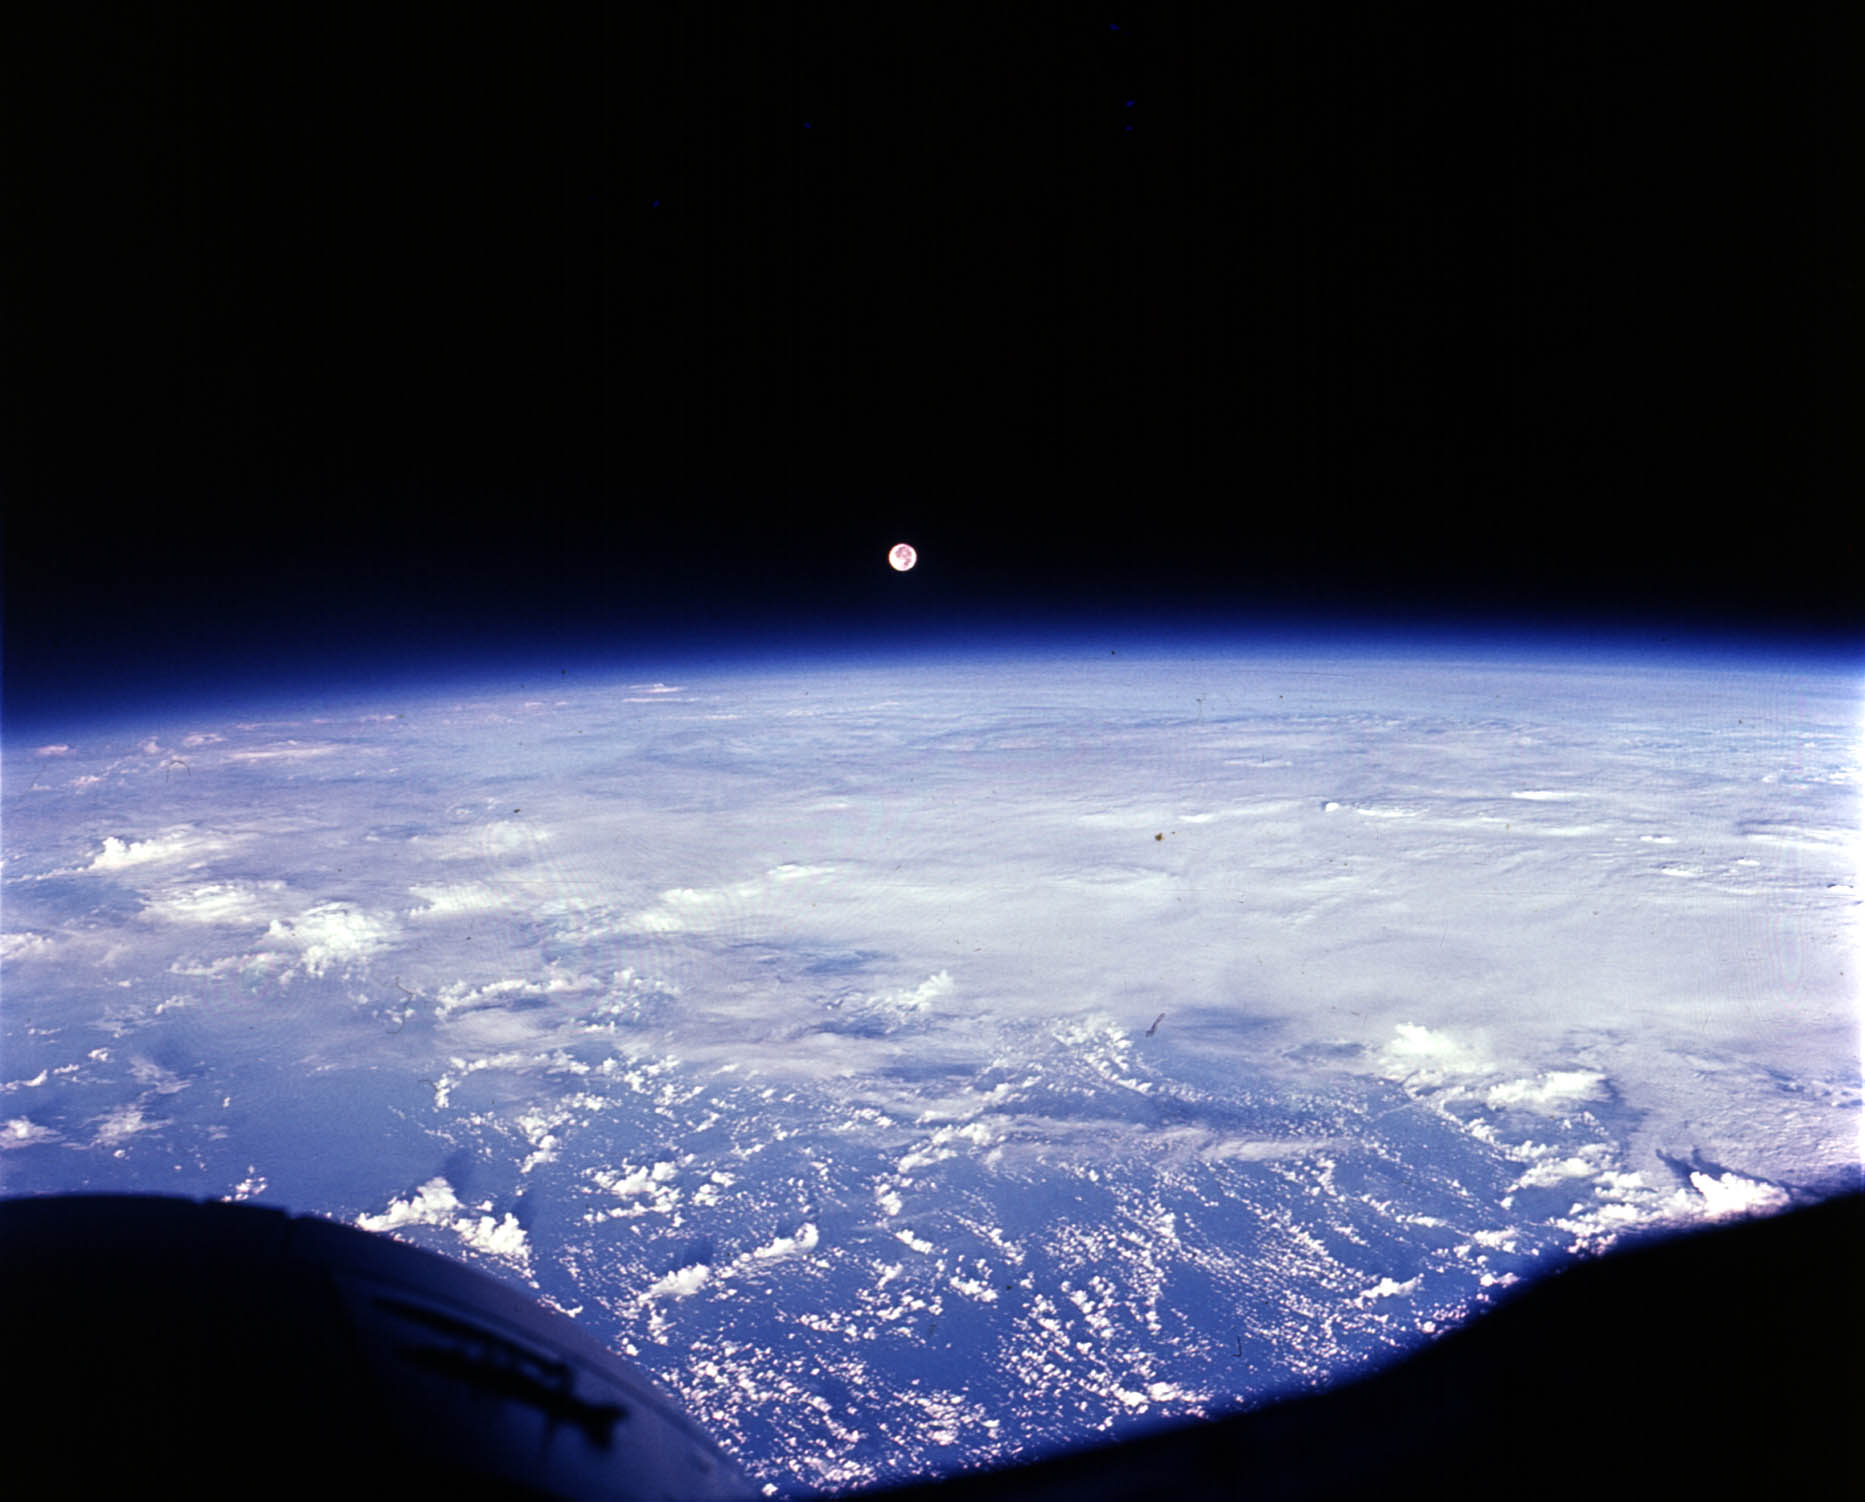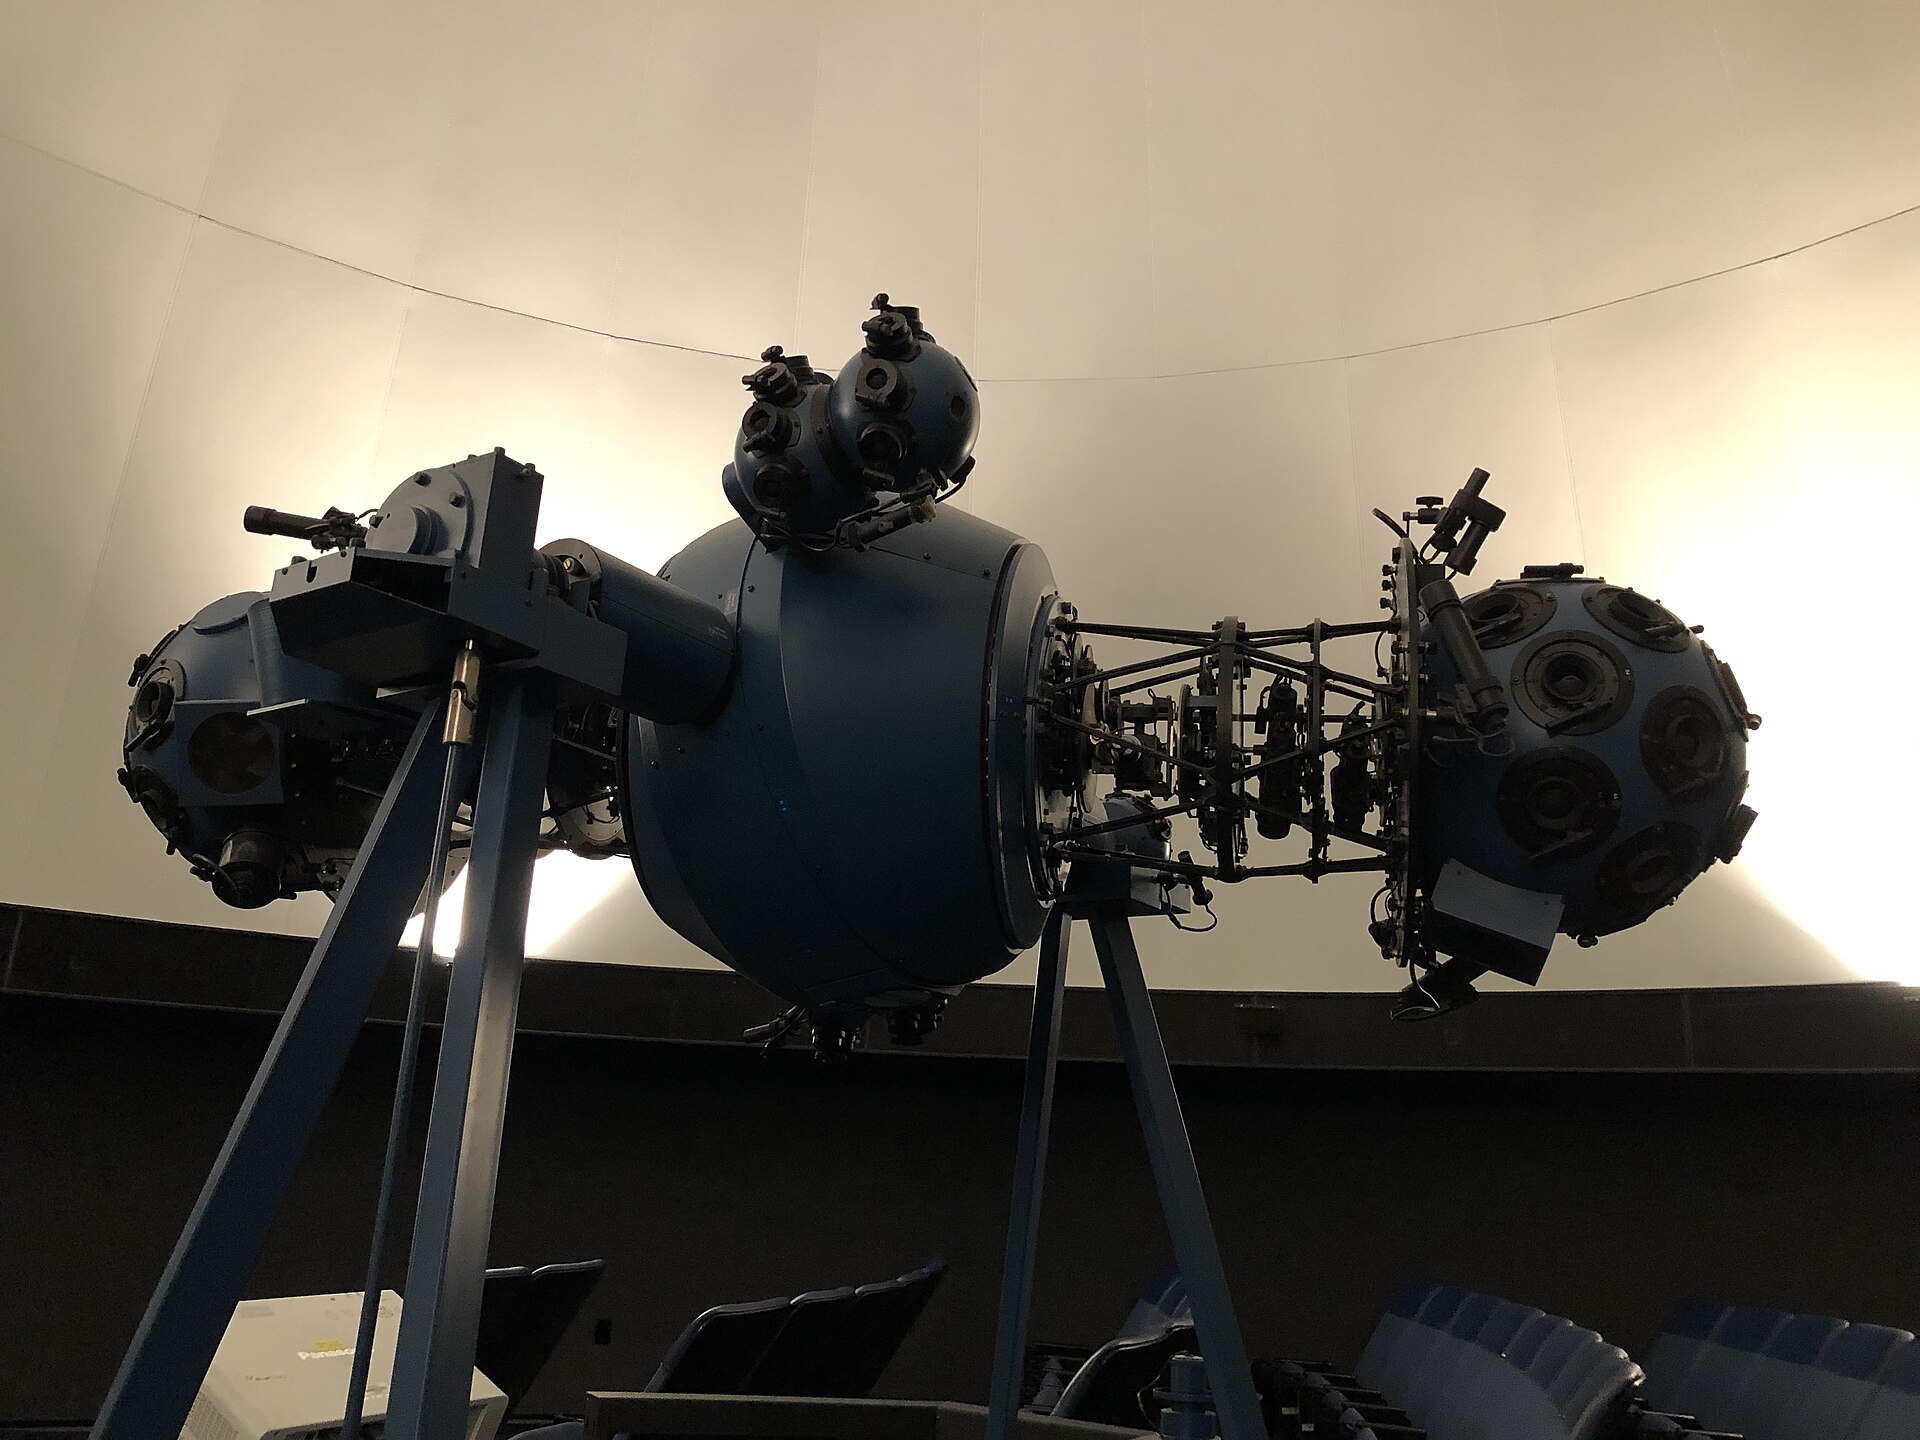
A custom star map can look like pure magic: enter the city where you met, choose the date, and the sky from that exact night rotates into place behind your names. There is no magic in it, and that is the point. A trustworthy poster is the output of ordinary, verifiable astronomy — time conversion, coordinate rotation, a measured star catalog and a projection that has been standard mathematics for four centuries. Once you know how each step works, you can check any maker's chart yourself. This guide explains the pipeline that our own star map poster uses, from the clock on your wall to the dots on your print.
From clock time to sidereal time
The sky keeps a different clock from the Sun. A solar day — noon to noon — averages 24 hours, but Earth's true rotation relative to the distant stars takes 23 hours 56 minutes and 4.1 seconds: the sidereal day. The missing four minutes accumulate, so the same stars rise about four minutes earlier every night, which is why a summer midnight and a winter midnight face entirely different constellations.
The tool first converts your local date and time into a Julian Day Number, a continuous day count that steps cleanly over calendar months and leap-year rules. It then computes Greenwich Mean Sidereal Time with the standard Meeus formula and adds your east longitude to obtain Local Sidereal Time, or LST. LST is itself an angle: the star currently crossing your meridian — the imaginary north–south line through the point overhead — has a right ascension exactly equal to the LST. One number, derived from your clock time and longitude, fixes how the celestial sphere is turned above you.
Right ascension and declination
To name a fixed position on the celestial sphere, astronomers use the sky's equivalent of longitude and latitude. Declination is measured in degrees north or south of the celestial equator, with Polaris sitting close to +90°. Right ascension is measured eastward in hours from the vernal equinox point — where the Sun crosses the equator each spring — and 24 hours wrap the full 360° circle, so one hour of right ascension equals 15°.
Catalog positions are quoted for an epoch, a fixed reference frame; modern charts use J2000, meaning where everything was at noon on 1 January 2000. Earth's axis wobbles like a slowing top through precession, dragging the equinox westward by about 50 arcseconds per year, but across a human lifetime that shifts a star by little more than one degree — small on a poster, and handled correctly in serious software for any date regardless.
Rotating equatorial coordinates onto your horizon
Right ascension and declination describe the whole Earth-independent sky. Your horizon, however, depends on where you stand, so every star must be rotated into a local frame with two practical answers: altitude (degrees above the horizon) and azimuth (compass direction around it).
First the hour angle is formed: H = LST − right ascension. Then, for an observer at latitude φ looking at a star at declination δ, the altitude comes from sin(alt) = sin φ sin δ + cos φ cos δ cos H, and the azimuth follows from the matching cosine and sine relations. These are the same hour-angle transformations an observatory uses. Their most important consequence for a map is a simple test: if a star's altitude is below zero, it lies under the horizon and must not be drawn. Apply that test honestly to a real catalog, and the familiar constellations tilt, rise and set exactly as they did on that night.
HYG, Hipparcos and measured stars
A chart is only as honest as its star list. Decorative generators scatter random dots; astronomical ones read a catalog. The maps on this site are drawn from a compact build of the HYG database — a merger of the Hipparcos, Tycho and Gliese catalogs — holding the brightest stars over the entire sky, each with measured right ascension, declination and visual magnitude.
Hipparcos was a European Space Agency satellite that measured stellar parallax from orbit, fixing the brighter stars to around a thousandth of an arcsecond. The HYG table also carries each star's Bayer or Flamsteed designation and the constellation it belongs to. Nothing printed on the poster is invented: if a dot appears, a named star at those measured coordinates produced it, brighter stars simply rendered with a larger point.
Why planets and the Moon can be placed to the arcminute
The planets are a different problem. They wander against the star background, so no fixed catalog row can give their place on your particular night. Their positions are instead computed from planetary theories — the VSOP series for the Sun and major planets, and the lunar ELP/Meeus series that sum hundreds of periodic terms describing the Moon's perturbed orbit. Ecliptic longitude from those series then passes through the same equatorial-to-horizon rotation as the stars.
For dates within a few centuries of the present, these series place the Sun, Moon and planets within a small fraction of an arcminute — vastly finer than any printed line can resolve. That is why the moon phase poster can show the exact illuminated fraction, earthshine tilt and lunar position for a chosen evening, rather than pasting a generic crescent beside the date.
Projecting the visible hemisphere
Altitude and azimuth live on a sphere, but paper is flat, so a projection is required. The circular layout uses stereographic projection: each point of the visible hemisphere is projected onto a plane tangent to the sky at the zenith, as if a light sat at the nadir and cast the star field onto the disk. Astronomers have favored it since the 1500s because circles on the sphere remain circles on the page, so constellation patterns are never smeared into strange curves near the rim.
The zenith becomes the center of the disk and the horizon its outer ring, with north, east, south and west reference marks laid down from the computed azimuths. A constellation segment is drawn only when both endpoint stars pass the altitude test, so no stick figure ever bends through the ground. A second, rectangular layout plots altitude directly for anyone who prefers a framed landscape over a disk.
"Computationally visible" is not what you actually saw
Here is the honesty every star-map buyer deserves. The geometry gives clear-sky, dark-sky, perfect-eyesight visibility; it cannot know the weather. A star that geometrically rose at 9:40 pm may have sat behind a thunderstorm, or drowned in the orange dome over a city center, where the naked-eye limit is often closer to magnitude 3 than the magnitude 6 of a rural sky.
Moonlight matters as well: a full Moon washes the faint Milky Way down to the brightest winter stars, so if you want the Moon drawn onto the chart it is worth checking its phase first. Treat the poster as the sky that was astronomically overhead — an accurate diagram of the moment — rather than a photograph of what any one person perceived. Our companion guide, are star maps accurate, shows how to compare that diagram with a planetarium app in about thirty seconds.
Magnitude, constellation lines and honest rendering
Stars are drawn larger when their measured magnitude is brighter. The scale runs backward — Vega near magnitude 0.03 is rendered bigger than a star at magnitude 4 — and optional cross-shaped diffraction rays can be added to the most luminous points, echoing the spikes seen in a real long-exposure photograph. Color themes change the mood from deep midnight blue through charcoal to a light gallery style without moving a single star.
On download, the poster is repainted from scratch at 300 dots per inch in your chosen print size, so every circle, segment and letter is set as fresh print-resolution graphics rather than a stretched screenshot. The article on print sizes and DPI explained works through why that repaint matters and how many pixels each frame size actually requires.
Make your own verifiable map
You can run the whole pipeline yourself in the browser with the free star map poster: pick a date and local time, choose from thousands of built-in cities or enter latitude and longitude, then switch between circular and rectangular layouts. For a birth, the birthday night sky version pre-fills the wording parents usually want; a twin version exists for siblings, and moon and zodiac variants cover the rest of the night-sky family.
Everything is computed locally — no date or place is ever uploaded — and the exported file carries no watermark. Because the star list, the sidereal-time math and the projection are all documented standards, you can open Stellarium side by side and watch the same constellations reach the same altitudes. That is the real test of a star map: not how romantic it looks, but whether the sky it draws actually happened.
一张定制星空地图看起来像魔法:输入你们相遇的城市,选好日期,那一夜的天空便带着两个人的名字转动到位。它背后其实没有任何魔法——这恰恰是关键。一张值得信任的海报,来自普通但可验证的天文学:时间换算、坐标旋转、一份实测星表,以及一种沿用了四百年的标准投影。懂得每一步的原理,你就能亲自检验任何商家的星图。本文解释我们自己的星空地图海报所使用的整条计算链路:从你墙上的钟,到印刷品上的每一个亮点。
从钟表时间到恒星时
天空走的钟与太阳不同。一个太阳日——正午到下一个正午——平均为二十四小时,但地球相对遥远恒星真正自转一周是 23 小时 56 分 4.1 秒,这就是恒星日。少掉的四分钟会累积:同样的恒星每天提前约四分钟升起,所以夏夜午夜与冬夜午夜面对的是完全不同的星座。
工具首先把你输入的当地日期与时间换算为儒略日数——一种连续计日体系,能干净地跨过月份与闰年规则;再用标准的 Meeus 公式计算格林尼治平恒星时,并加上你所在的东经,得到地方恒星时(LST)。地方恒星时本身就是一个角度:此刻正经过你子午线——穿过天顶的那条假想南北线——的恒星,其赤经恰好等于地方恒星时。仅凭这一个由钟表时间与经度算出的数字,天球在你头顶转动的角度就被唯一确定。
赤经与赤纬
为了标注恒星在天球上的固定位置,天文学家使用的是天球版的经纬度。赤纬以天赤道向北或向南的度数计量,北极星就在接近 +90° 的位置;赤经从春分点——太阳每年春天穿越天赤道的位置——起算,沿东向以小时计量,24 小时绕完整圈 360°,因此赤经一小时对应 15°。
星表中的位置都对应某个历元,即一个固定的参考坐标系;现代星图普遍采用 J2000 历元,也就是 2000 年 1 月 1 日正午各天体所在的位置。地轴会像减速的陀螺一样岁差摆动,使春分点每年西移约 50 角秒,但在人的一生尺度内,恒星位置只移动一度出头,在海报上几乎不可察;而严谨的软件对任何日期都会正确处理这一项。
把天球坐标转到你的地平线
赤经与赤纬描述的是与地球无关的整片天空,但你看到的地平线取决于你站在哪里。因此每颗恒星都必须被旋转到一个当地坐标系中,得到两个直观的量:高度角(高出地平线的度数)与方位角(沿地平线的罗盘方向)。
第一步先求时角:H = 地方恒星时 − 赤经。对于纬度 φ 的观测者、赤纬 δ 的恒星,高度角满足 sin(h) = sin φ sin δ + cos φ cos δ cos H,方位角则由配套的余弦、正弦关系求出——这正是天文台所用的标准时角变换。对星图而言,它最重要的推论是一条极简单的判定:只要高度角小于零,这颗星就在地平线以下,不能画出来。把这条判定诚实地施加于一份真实星表,熟悉的星座便会如那一夜真实发生的那样倾斜、升起与落下。
HYG、依巴谷与实测恒星
星图的可信度,取决于恒星清单的可信度。装饰类生成器随机撒点,天文类生成器读取星表。本站星图绘制自 HYG 数据库的精简版本——它合并了依巴谷(Hipparcos)、第谷(Tycho)与格利泽(Gliese)星表——收录全天最亮的恒星,每颗都带有实测赤经、赤纬与视星等。
依巴谷是欧洲空间局的天体测量卫星,从轨道上测量恒星视差,把亮星位置定到约千分之一角秒。HYG 表格还记录每颗星的拜耳命名或弗兰斯蒂德编号,以及它所属的星座。海报上没有任何凭空发明的点:只要画面上出现一个亮点,就对应一颗有名字、有实测坐标的恒星,越亮的星画得越大。
行星与月球为何能精确到角分
行星是另一类问题。它们相对恒星背景不断游走,任何固定的星表行都无法给出它们在你那一夜的位置。它们的坐标由行星理论计算得出:太阳与大行星使用 VSOP 级数,月球使用 ELP/Meeus 月球级数——后者由数百个周期项叠加,描述受摄动的月球轨道。由级数得到的黄经,再与恒星一样经过赤道坐标到地平坐标的旋转。
对距今几百年以内的日期,这些级数能把太阳、月球与行星的位置定到远小于一角分的精度,远超任何印刷线条的分辨能力。正因如此,月相海报才能为某个夜晚呈现准确的亮面比例、地球反照倾角与月球方位,而不是在日期旁边贴一个通用的月牙图标。
把可见半球投影到纸面
高度角与方位角存在于球面上,而纸是平的,必须借助投影。圆形版式采用立体投影:设想天底处有一盏灯,把可见半球上的每个点投射到天顶处与球面相切的平面上。自十六世纪以来天文学家一直偏爱这种投影,因为球面上的圆在纸上仍然是圆,星座图案绝不会在圆盘边缘被拉扯成怪异的曲线。
天顶成为圆盘的中心,地平线成为外缘圆环,北、东、南、西参考标记按计算出的方位角放置。星座连线只有当两个端点都通过高度角检验时才绘制,因此小人造型绝不会有哪一段穿过地面。另有矩形版式直接按高度角绘制天空,适合偏好横向装框画面的人。
"计算上可见"不等于"实际肉眼所见"
这是每个星图购买者都应得到的诚实说明:几何计算给出的,是晴天、暗夜、理想视力下的可见性,它无法知道天气。一颗在几何上于晚上 9:40 升起的星,可能正藏在雷雨云后,也可能淹没在城市中心的橙色光穹顶里——那里的肉眼极限往往更接近 3 等,而不是乡野天空的 6 等。
月光同样关键:一轮满月会把暗淡的银河冲刷得只剩冬季最亮的几颗星,所以如果你希望把月球画进图里,最好先查一查当晚的月相。请把海报理解为"天文学意义上悬在头顶的那片天空"——一个关于那一刻的准确图解——而不是某人当时肉眼所见的照片。配套文章星空地图准确吗演示了如何用约三十秒在天文软件中比对这张图解。
星等、星座连线与诚实的渲染
实测星等越亮的恒星画得越大。星等刻度是反向的:织女星约 0.03 等,会画得比一颗 4 等星更大;还可以为最亮的点加上十字形衍射光芒,模拟真实长曝光照片里的星芒。配色主题可以在深夜蓝、炭黑、霁蓝与素白画廊风之间切换,却不会移动任何一颗恒星。
点击下载时,海报会按你选择的尺寸以每英寸 300 点从零重绘,每一个圆点、线段与文字都是印刷分辨率下的全新图形,而非被拉大的截图。印刷尺寸与 DPI 详解一文会展开说明为什么这次重绘如此重要,以及每个装框尺寸究竟需要多少像素。
亲手做一张可验证的星图
你可以在浏览器里亲自跑完整条流程:选择日期与当地时间,从数千个内置城市中挑选,或直接输入经纬度,再在圆形与矩形版式间切换。若是为出生纪念制作,生日夜空海报版本预置了父母常用的文字排版;双胞胎有双人夜空版本,月相与黄道星座版本则覆盖了夜空系列的其余主题。
所有计算都在本地完成——日期与地点不会被上传——导出的文件也没有水印。由于星表、恒星时公式与投影都是公开的标准,你可以在旁边打开 Stellarium,看着同样的星座抵达同样的高度角。这才是星图真正的检验标准:不在于它看起来多浪漫,而在于它画出的那片天空,是否真的发生过。